Posts Tagged: ‘Wireshark’

Network layer name resolution in Wireshark

1. August 2014 Posted by Ralf Petter

Normally Wireshark does not make a reverse lookup for network layer addresses, which makes it sometime hard to find out to which communication a IP packet belongs.


Fortunately there is an option to enable the name resolution for the network layer. Just select the  "View->Name Resolution->Enable for Network Layer" option.


Now every IP Address which has a DNS name assigned, will be automatically resolved in your network trace.


Easy packet filtering with Wireshark

31. Juli 2014 Posted by Ralf Petter

Wireshark the ultimate tool to solve network problems have so many filter possibilities, that it is often very difficult to find the correct one for your need in the Filter expression dialog.


But fortunately there is an easy way to create a filter. Simply click on the field in the packet trace detail for which you want to create a filter with the right mouse button and choose the correct "Apply as Filter" context menu. If you have already set a filter and want to add the field as an additional filter criteria choose one of the "... xxxx" entries. That's so easy that i am really angry i had not known this earlier.


Another tip for beginners of wireshark is to use the Follow TCP or UDP Stream Context Menu. When you select this option on a packet you get the whole communication to which this packet belongs.


This is very useful to analyze http traffic or to solve problems in REST communications.

Analyze IBM i Communication Trace with Wireshark.

30. April 2014 Posted by Ralf Petter

One of the most valuable tools to solve problems in networks is the communication trace. Fortunately IBM i has a very powerful trace tool built in the core os, so if you want to trace your network traffic to and from your IBM i you do not need the network guy to implement port mirroring or other network analyzing techniques. But the weak point of the comm trace tool is, that the generated reports are not very easy to view and are a little bit confusing.

So in today's post i want to show you how you can trace your communication and export the traced data to the best open source network traffic analyzer Wireshark:

1. Start a communication trace

STRCMNTRC CFGOBJ(ETHLINE) CFGTYPE(*LIN) MAXSTG(64M) 

Replace "ETHLINE" with the name of the Network line which you want to trace. If you get the error CPF39A6 you can either reduce the MAXSTG parameter or create a bigger comm trace area in the system service programs.

2. Reproduce your problem.

3. End the communication trace.

 ENDCMNTRC CFGOBJ(ETHLINE) CFGTYPE(*LIN)

4. Dump the Communication Trace to the IFS in PCAP format

DMPCMNTRC CFGOBJ(ETHLINE) CFGTYPE(*LIN) TOSTMF('/tmp/commtrace') REPLACE(*YES) FORMAT(*PCAP)   

Replace "ETHLINE" with the name of the Network line which you want to trace and the TOSTMF Parameter with the path in the IFS where you want to export your comm trace. The IFS path should be available as Windows share to clients over Netserver.

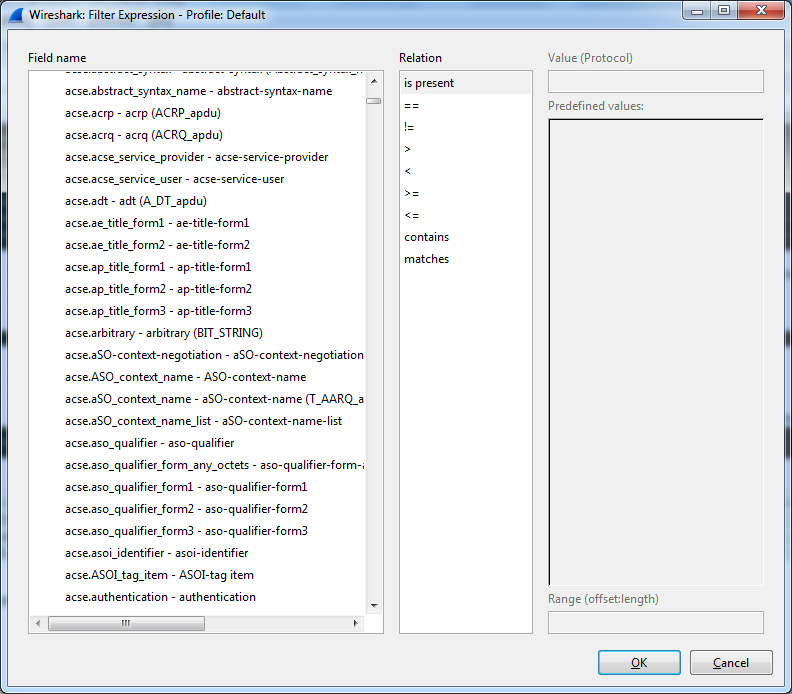
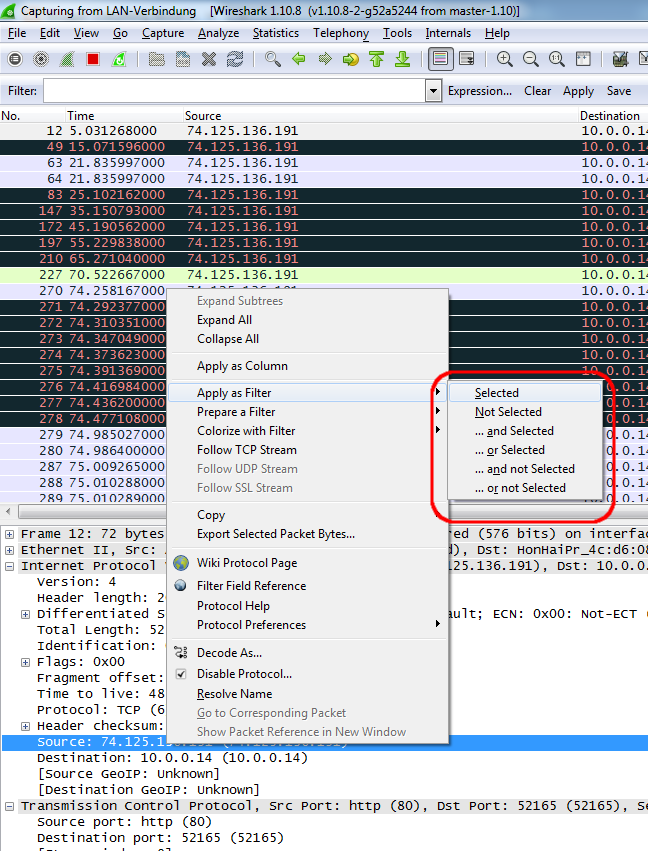
5. Open Wireshark and choose the option to open the previous captured file from the IFS.

                                               
Now you can filter and analyze your problem with the most advanced open source network analyzer available.

Other useful Display filters in Wireshark

26. Juni 2013 Posted by Ralf Petter


In one of my last posts i have talked about how to trace DHCP communication in Wireshark. Today i want to show you some other very usefull Displayfilters in Wireshark.

ip.addr==xxx.xxx.xxx.xxx

Display all IP traffic coming from or going to the specified IP Address.

eth.addr==xx:xx:xx:xx:xx:xx

Display all Network traffice coming from or going to the specified Mac Address.

You can replace the "==" with contains to search for a part of an address. For example if you want the whole traffice from and to 10.0.10.x then use ip.addr contains 10.0.10.

It is possible to combine filters with the logic operators "and, or, xor, not" For xample "ip.addr==10.0.0.10 and not eth.addr==45:20:24:ff:5a:18" checks if there are packets with ip address 10.0.0.10 which do not come from the correct network adapter.

!arp

Hide Address Resolution Protocol packets to prevent the flood of them in your communication trace.
 
http.set_cookie

See all packets in the communication trace which sets cookies.

http.cookie

See all packets in the communication trace which transport cookies to remote servers.


You can specify the protocol like "smb","http" or "smtp"... of the traffic you want to analyze and all other protocols will be hidden in your trace.

A very good cheat sheet about the available Display filters is available from packetlife.net


Trace DHCP traffic with wireshark

25. Juni 2013 Posted by Ralf Petter

The best tool to analyze weird problems in DHCP Systems is the network analysator Wireshark. But the network traces of wireshark can be very big and confusing. So you have to use filters to select only the traffic you really need to solve your problem. To see only DHCP traffic on your network interface you have to apply "bootp.option.type==53" in Wireshark.